1 How to Make a Bar Graph in Excel2 How to Format Your Excel Bar Graph3 Extra: How to Find Duplicates in Excel and Remove Them4 Extra: How to Customize the Ribbon in Microsoft Word, PowerPoint, Excel, and Outlook
How to graph in Excel Thankfully, Microsoft makes this quite simple. Excel’s dedicated graphing tools allow you to quickly switch between a variety of chart types and customize them once you’ve chosen. Before we continue with this guide, however, it’s important to consider whether a bar graph is the best choice for your data. Bar charts are best used when you can make direct comparisons between your data. For example, you have a list of countries and their life expectancies. Once your data gets more complex, or you want to show things like trends or distribution, scatter, line, bubble, and pie graphs are usually better. That said, if you know what you need, below we have a guide to show you how to create a bar chart in Excel and customize it to your liking:
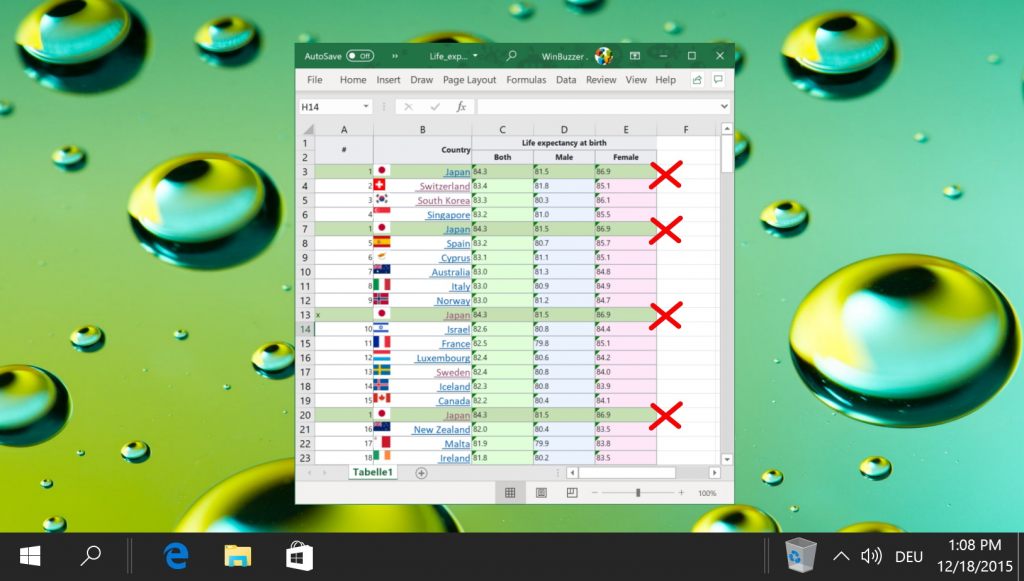
Extra: How to Find Duplicates in Excel and Remove Them
You now know how to make a bar graph in Excel, but what if you have duplicates in the data itself? Our guide will show you how to remove duplicates from your data so they don’t show in your graph.
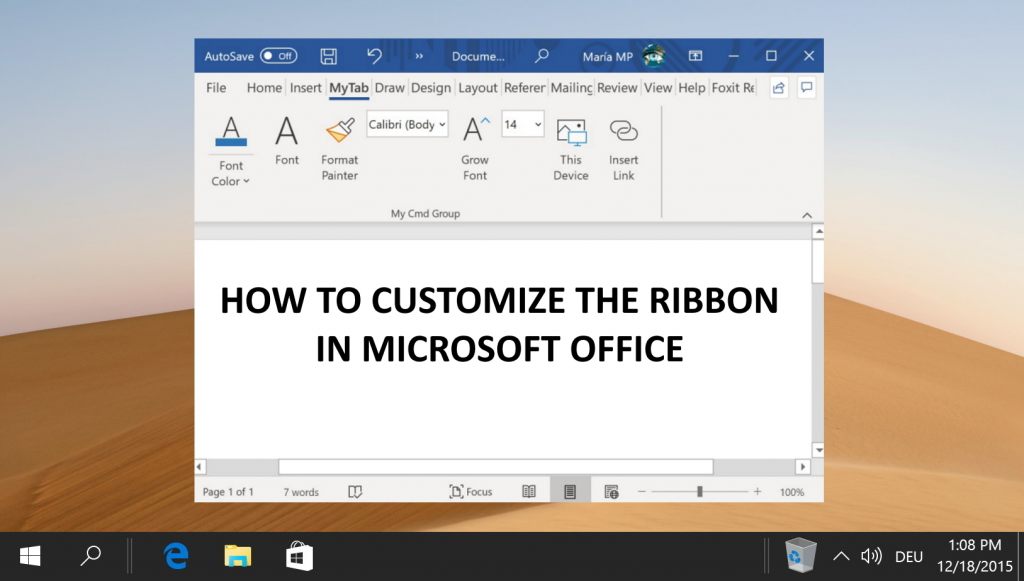
Extra: How to Customize the Ribbon in Microsoft Word, PowerPoint, Excel, and Outlook
If you’re planning to do a lot of graphing in Excel, you may also want to read our guide on how to customize the Excel ribbon. You can use this to place all the tools you need directly at your fingertips.